Elastic Stack
Setup
We will be using a virtual machine in the faculty's cloud.
When creating a virtual machine in the Launch Instance window:
- Select Boot from image in Instance Boot Source section
- Select SCGC Template in Image Name section
- Select the m1.elk flavor.
In the base virtual machine:
- Download the laboratory archive from here in the
workdirectory. Use:wget https://repository.grid.pub.ro/cs/scgc/laboratoare/lab-elk.zipto download the archive. - Extract the archive.
The
.qcow2files will be used to start virtual machines using therunvm.shscript. - Start the virtual machines using
bash runvm.sh. - The username for connecting to the nested VMs is
studentand the password isstudent.
$ # change the working dir
$ cd ~/work
$ # download the archive
$ wget https://repository.grid.pub.ro/cs/scgc/laboratoare/lab-elk.zip
$ unzip lab-elk.zip
$ # start VMs; it may take a while
$ bash runvm.sh
$ # check if the VMs booted
$ virsh net-dhcp-leases labvms
Introduction
The Elastic Stack is a collection of software products used for data and log
collection, storage, analysis and visualization. It is one of the most used
enterprise platforms. In this lab, we will deploy and configure the Elastic
Stack (Elasticsearch, Logstash, Kibana) on a host (the elk VM) and configure
another host (the helper VM) to collect data from and send it to our Elastic
Stack VM by using Beats, a collection of lightweight data shippers.
Lab topology


As presented in the scheme above, our architecture is the following:
- the
elkVM - this will run the Elastic Stack components (Elasticsearch, Kibana and Logstash) - the
helperVM - this will play the role of a monitored host in our environment. We will install various Beats and services with the purpose of collecting data from it.
In a real life scenario, the Elastic Stack might run in a different network than the monitored hosts, and the number of monitored hosts would be higher.
Installation and configuration
The Elastic team provides multiple installation option. For the sake of simplicity, we will use the precompiled packages for the specific distributions we are using and briefly discuss other deployment options at the end.
For this lab we will use 2 virtual machines (systems). A system will be the location of the Elastic Stack (Elasticsearch, Kibana and, eventually, Logstash). This system runs AlmaLinux 8, so we will use RPM packages to install the components. The other system will represent a machine we want to monitor and will run various Beats. It runs Ubuntu 20.04, so we will use DEB packages to install the Beats.
Elasticsearch
We will install Elasticsearch on the lab-elk-1 (lab-elk) VM.
Download the RPM package and its signature using the commands below.
[root@elk ~] wget https://artifacts.elastic.co/downloads/elasticsearch/elasticsearch-8.7.0-x86_64.rpm
[root@elk ~] wget https://artifacts.elastic.co/downloads/elasticsearch/elasticsearch-8.7.0-x86_64.rpm.sha512
Don’t forget to check the hash in order to protect from supply chain attacks.
[root@elk ~]$ sha512sum -c elasticsearch-8.7.0-x86_64.rpm.sha512
elasticsearch-8.7.0-x86_64.rpm: OK
If the checksum is ok, continue installing.
During the installation process, elasticsearch will print to the terminal
important information (such as the password of the default elastic user).
We will need some of if later in the lab.
Copy it to a file on your local machine so you are able to refer to it later.
[root@elk ~]$ rpm --install elasticsearch-8.7.0-x86_64.rpm
warning: elasticsearch-8.7.0-x86_64.rpm: Header V4 RSA/SHA512 Signature, key ID d88e42b4: NOKEY
Creating elasticsearch group... OK
Creating elasticsearch user... OK
--------------------------- Security autoconfiguration information ------------------------------

Authentication and authorization are enabled.
TLS for the transport and HTTP layers is enabled and configured.

The generated password for the elastic built-in superuser is : J6qXS0=rZtQYz25*MEaC

If this node should join an existing cluster, you can reconfigure this with
'/usr/share/elasticsearch/bin/elasticsearch-reconfigure-node --enrollment-token <token-here>'
after creating an enrollment token on your existing cluster.

You can complete the following actions at any time:

Reset the password of the elastic built-in superuser with
'/usr/share/elasticsearch/bin/elasticsearch-reset-password -u elastic'.

Generate an enrollment token for Kibana instances with
 '/usr/share/elasticsearch/bin/elasticsearch-create-enrollment-token -s kibana'.

Generate an enrollment token for Elasticsearch nodes with
'/usr/share/elasticsearch/bin/elasticsearch-create-enrollment-token -s node'.

-------------------------------------------------------------------------------------------------
### NOT starting on installation, please execute the following statements to configure elasticsearch service to start automatically using systemd
 sudo systemctl daemon-reload
 sudo systemctl enable elasticsearch.service
### You can start elasticsearch service by executing
 sudo systemctl start elasticsearch.service
[/usr/lib/tmpfiles.d/elasticsearch.conf:1] Line references path below legacy directory /var/run/, updating /var/run/elasticsearch → /run/elasticsearch; please update the tmpfiles.d/ drop-in file accordingly.
As seen in the output above, this method of installation defaults to using TLS for all connections. We will keep this unchanged, since it is good practice, but this means we will need to configure additional options for the other services that are trying to connect to Elasticsearch.
Peek into the systemd service file
You can take a look into the service file if you want to see some of the environmental values and tweaks that you would have to do when installing from source. More on that here.
[Unit]
#[...]

[Service]
#[...]
Environment=ES_HOME=/usr/share/elasticsearch
Environment=ES_PATH_CONF=/etc/elasticsearch
Environment=PID_DIR=/var/run/elasticsearch
Environment=ES_SD_NOTIFY=true
EnvironmentFile=-/etc/sysconfig/elasticsearch

WorkingDirectory=/usr/share/elasticsearch

User=elasticsearch
Group=elasticsearch

# [...]

# Specifies the maximum file descriptor number that can be opened by this process
LimitNOFILE=65535

# Specifies the maximum number of processes
LimitNPROC=4096

# Specifies the maximum size of virtual memory
LimitAS=infinity

# Specifies the maximum file size
LimitFSIZE=infinity

# [...]
Useful locations
For RPM-based distributions, these are the folders where Elasticsearch and its related tools and configuration files can be found:
-
/usr/share/elasticsearchThis is where various elasticsearch related tools are located
[root@elk ~]# ls -la /usr/share/elasticsearch
total 2228
drwxr-xr-x.  7 root root     129 Apr 19 16:27 .
drwxr-xr-x. 76 root root    4096 Apr 19 16:27 ..
drwxr-xr-x.  2 root root    4096 Apr 19 16:27 bin
drwxr-xr-x.  8 root root      96 Apr 19 16:27 jdk
drwxr-xr-x.  5 root root    4096 Apr 19 16:27 lib
-rw-r--r--.  1 root root    3860 Mar 27 19:30 LICENSE.txt
drwxr-xr-x. 70 root root    4096 Apr 19 16:27 modules
-rw-r--r--.  1 root root 2251227 Mar 27 19:32 NOTICE.txt
drwxr-xr-x.  2 root root       6 Mar 27 19:37 plugins
-rw-r--r--.  1 root root    8106 Mar 27 19:30 README.asciidoc
Of interest to us are the
binandjdkdirectories. Thebindirectory contains useful tools, such as the CLI andelasticsearch-reset-password(in case you lost the initial password that was outputted during installation). Since Elasticsearch is written in Java, thejdkdirectory contains a packaged Java Development Kit (including the JRE). -
/etc/elasticsearch- the main configuration directory[root@elk ~]# ls -la /etc/elasticsearch
total 60
drwxr-s---. 4 root elasticsearch 4096 Apr 19 16:38 .
drwxr-xr-x. 79 root root 8192 Apr 19 16:28 ..
drwxr-x---. 2 root elasticsearch 62 Apr 19 16:28 certs
-rw-rw----. 1 root elasticsearch 536 Apr 19 16:28 elasticsearch.keystore
-rw-rw----. 1 root elasticsearch 1042 Mar 27 19:34 elasticsearch-plugins.example.yml
-rw-rw----. 1 root elasticsearch 4048 Apr 19 16:28 elasticsearch.yml
-rw-rw----. 1 root elasticsearch 2623 Mar 27 19:34 jvm.options
drwxr-s---. 2 root elasticsearch 6 Mar 27 19:37 jvm.options.d
-rw-rw----. 1 root elasticsearch 17770 Mar 27 19:34 log4j2.properties
-rw-rw----. 1 root elasticsearch 473 Mar 27 19:34 role_mapping.yml
-rw-rw----. 1 root elasticsearch 197 Mar 27 19:34 roles.yml
-rw-rw----. 1 root elasticsearch 0 Mar 27 19:34 users
-rw-rw----. 1 root elasticsearch 0 Mar 27 19:34 users_rolesThe
elasticsearch.ymlfile contains the main configuration. Fortunately, elasticsearch comes with decent configuration options that we don’t need to change.jvm.optionsand thejvm.options.dfolder are used to configure JVM related settings, such as maximum memory usage. -
/etc/elasticsearch/certsThis is the location of the certificates generated during the installation and used for secure communication between the Elastic Stack components.
[root@elk ~]# ls -la /etc/elasticsearch/certs
total 28
drwxr-x---. 2 root elasticsearch    62 Apr 19 16:28 .
drwxr-s---. 4 root elasticsearch  4096 Apr 19 16:38 ..
-rw-rw----. 1 root elasticsearch  1915 Apr 19 16:28 http_ca.crt
-rw-rw----. 1 root elasticsearch 10013 Apr 19 16:28 http.p12
-rw-rw----. 1 root elasticsearch  5822 Apr 19 16:28 transport.p12
As of now, elasticsearch is only installed. In order to enable and start the service use
[root@elk ~]$ systemctl daemon-reload
[root@elk ~]$ systemctl enable --now elasticsearch
We can check that everything is working correctly by sending a request to the Elasticsearch instance.
[root@elk ~]$ curl --cacert /etc/elasticsearch/certs/http_ca.crt -u elastic https://localhost:9200
Enter host password for user 'elastic':
{
  "name" : "elk",
  "cluster_name" : "elasticsearch",
  "cluster_uuid" : "NTHTJiGyRYy_G6cbJ6G6MA",
  "version" : {
    "number" : "8.7.0",
    "build_flavor" : "default",
    "build_type" : "rpm",
    "build_hash" : "09520b59b6bc1057340b55750186466ea715e30e",
    "build_date" : "2023-03-27T16:31:09.816451435Z",
    "build_snapshot" : false,
    "lucene_version" : "9.5.0",
    "minimum_wire_compatibility_version" : "7.17.0",
    "minimum_index_compatibility_version" : "7.0.0"
  },
  "tagline" : "You Know, for Search"
}
Since the certificates generated by Elasticsearch upon installation are self-signed, we need to specify the location of the CA certificate in order for curl to verify the certificate of the Elasticsearch cluster.
Before we continue - firewall configuration
The AlmaLinux distribution we are using comes with a preconfigured firewall that does not allow traffic to port 9200 (the default elasticsearch port).
You can permit traffic to that port using the command firewall-cmd --add-service=elasticsearch.
Verify this worked by issuing a curl request from your Openstack VM to the VM
running Elasticsearch.
student@openstack-vm:~$ curl -k -u elastic https://192.168.100.101:9200/
Enter host password for user 'elastic':
{
  "name" : "elk",
  "cluster_name" : "elasticsearch",
  "cluster_uuid" : "NTHTJiGyRYy_G6cbJ6G6MA",
  "version" : {
    "number" : "8.7.0",
    "build_flavor" : "default",
    "build_type" : "rpm",
    "build_hash" : "09520b59b6bc1057340b55750186466ea715e30e",
    "build_date" : "2023-03-27T16:31:09.816451435Z",
    "build_snapshot" : false,
    "lucene_version" : "9.5.0",
    "minimum_wire_compatibility_version" : "7.17.0",
    "minimum_index_compatibility_version" : "7.0.0"
  },
  "tagline" : "You Know, for Search"
}
You will have to do this for Kibana as well.
Kibana
While we can use the Elasticsearch API to search the database, this is cumbersome and hard to visualize. We will deploy Kibana for this, running on the same machine.
First, download the Kibana RPM package and checksum, check the checksum and install.
[root@elk ~]$ wget https://artifacts.elastic.co/downloads/kibana/kibana-8.7.0-x86_64.rpm
[root@elk ~]$ wget https://artifacts.elastic.co/downloads/kibana/kibana-8.7.0-x86_64.rpm.sha512
[root@elk ~]$ sha512sum -c kibana-8.7.0-x86_64.rpm.sha512
kibana-8.7.0-x86_64.rpm: OK
[root@elk ~]$ rpm --install kibana-8.7.0-x86_64.rpm
warning: kibana-8.7.0-x86_64.rpm: Header V4 RSA/SHA512 Signature, key ID d88e42b4: NOKEY
Creating kibana group... OK
Creating kibana user... OK
Created Kibana keystore in /etc/kibana/kibana.keystore
[/usr/lib/tmpfiles.d/elasticsearch.conf:1] Line references path below legacy directory /var/run/, updating /var/run/elasticsearch → /run/elasticsearch; please update the tmpfiles.d/ drop-in file accordingly.
Before starting the Kibana service we need to configure it to connect to our
Elasticsearch instance. This can be easily done with the use of an enrollment
token. To generate an enrollment token, go to the /usr/share/elasticsearch/bin/
directory and use the elasticsearch-create-enrollment-token binary.
[root@elk bin]# ./elasticsearch-create-enrollment-token -s kibana
eyJ2ZXIiOiI4LjcuMCIsImFkciI6WyIxOTIuMTY4LjEwMC4xMDE6OTIwMCJdLCJmZ3IiOiI0ODM3M2U3ZjY2NTM2NjViMGVmOGRkOWI1OWVlNzk4M2FmNDJlMTU4MjRlNDNjYTBiMTY2NDIzNzNiOTNjODI2Iiwia2V5IjoiZHlTb29vY0JiSkYySTVXbEpIMEc6Uy1ia2NkbVJUb0dCSXN4bGpwOE8wZyJ9
After this, run kibana-setup as the Kibana user.
[root@elk ~]# sudo -u kibana /usr/share/kibana/bin/kibana-setup --enrollment-token <enrollment-token>

✔ Kibana configured successfully.

To start Kibana run:
  bin/kibana
Peek into the enrollment-token
The token is a base64 encoded JSON containing some information about the Elasticsearch host(s) and a few secret variables. Kibana will reach to an API endpoint in for further configuration. More here.
$ echo "eyJ2ZXIiOiI4LjcuMCIsImFkciI6WyIxOTIuMTY4LjEwMC4xMDE6OTIwMCJdLCJmZ3IiOiI0ODM3M2U3ZjY2NTM2NjViMGVmOGRkOWI1OWVlNzk4M2FmNDJlMTU4MjRlNDNjYTBiMTY2NDIzNzNiOTNjODI2Iiwia2V5IjoiZHlTb29vY0JiSkYySTVXbEpIMEc6Uy1ia2NkbVJUb0dCSXN4bGpwOE8wZyJ9" | base64 -d | jq .
{
  "ver": "8.7.0",
  "adr": [
    "192.168.100.101:9200"
  ],
  "fgr": "48373e7f6653665b0ef8dd9b59ee7983af42e15824e43ca0b16642373b93c826",
  "key": "dySooocBbJF2I5WlJH0G:S-bkcdmRToGBIsxljp8O0g"
}
We also need to configure Kibana to listen on all interfaces. To do that, add
the line server.host: "0.0.0.0" to the /etc/kibana/kibana.yml file, or find
the commented one and modify it.
Now, we can go ahead and start Kibana using systemd.
[root@elk ~]# systemctl daemon-reload
[root@elk ~]# systemctl enable --now kibana
Created symlink /etc/systemd/system/multi-user.target.wants/kibana.service → /usr/lib/systemd/system/kibana.service.
Firewall configuration
Don’t forget to open the port in the firewall.
firewall-cmd --add-service=kibana
Connect to the Kibana instance on port 5601 using a browser and ssh as a SOCKS proxy.
Revisit the LDAP lab if you do not remember how to do that.
Login using the credentials printed by Elasticsearch in the installation process and wait for the initial setup to be done. Check that you can access the Kibana UI. This might take a few minutes on the lab infrastructure. You can read the next section in the meantime.
Alternative installation methods
- DEB/RPM repositories
- Docker
Instead of downloading the packages you can use your distribution’s package manager by installing the PGP key of Elasticsearch and adding the repositories. Below are the steps for RPM.
-
Import the PGP key
rpm --import https://artifacts.elastic.co/GPG-KEY-elasticsearch -
Create the file
/etc/yum.repos.d/elasticsearch.repowith the content below[elasticsearch]
name=Elasticsearch repository for 8.x packages
baseurl=https://artifacts.elastic.co/packages/8.x/yum
gpgcheck=1
gpgkey=https://artifacts.elastic.co/GPG-KEY-elasticsearch
enabled=0
autorefresh=1
type=rpm-md -
Install the packages
sudo yum install --enablerepo=elasticsearch elasticsearch
There are also Docker containers built for all the Elastic Stack components. The steps to use them look something like this:
-
Pull the image
docker pull docker.elastic.co/elasticsearch/elasticsearch:8.7.0 -
Create a network for Elasticsearch and Kibana
docker network create elastic -
Start Elasticsearch and/or Kibana
docker run --name es01 --net elastic -p 9200:9200 -it docker.elastic.co/elasticsearch/elasticsearch:8.7.0
For more details check the documentation.
Monitoring web server logs with Filebeat
As you might observe when opening Kibana and clicking around, it is quite empty right now. That is because we don’t have any collected data in Elasticsearch. In this section we will install and configure Filebeat in order to send Nginx logs from our second VM to Elasticsearch.
Before we begin
Since the elastic user has the superuser role, it can do any action in both
Kibana and Elasticsearch. In order to ingest metrics from various Beats, we will
need to connect to Elasticsearch and Kibana using a user with the right
permissions. It is good practice to create such an user for every ingest source
you have, restricting the permissions to the minimum necessary
(Principle of Least Privilege),
but for brevity we will use the elastic user. You can read more about setting
up a user with the necessary permissions here
and here.
Installing and configuring Filebeat
The installation process is similar to Elaticsearch and Kibana:
-
Download the DEB package and signature
root@helper:~# wget https://artifacts.elastic.co/downloads/beats/filebeat/filebeat-8.7.0-amd64.deb
root@helper:~# wget https://artifacts.elastic.co/downloads/beats/filebeat/filebeat-8.7.0-amd64.deb.sha512 -
Check the signature is ok
root@helper:~# sha512sum -c filebeat-8.7.0-amd64.deb.sha512
filebeat-8.7.0-amd64.deb: OK -
Install using
dpkgroot@helper:~# dpkg -i filebeat-8.7.0-amd64.deb
Selecting previously unselected package filebeat.
(Reading database ... 38899 files and directories currently installed.)
Preparing to unpack filebeat-8.7.0-amd64.deb ...
Unpacking filebeat (8.7.0) ...
Setting up filebeat (8.7.0) ...
Processing triggers for systemd (245.4-4ubuntu3.21) ...
Before we start sending log data we need to configure a few things.
Filebeat comes with multiple modules. Each module is responsible for parsing specific application logs and sending them to Elasticsearch (or Logstash) with minimal configuration necessary. To see a list of all the modules you can run:
root@helper:~# filebeat modules list
Enabled:

Disabled:
activemq
apache
auditd
aws
[...]
traefik
zeek
zookeeper
zoom
zscaler
We can see that no module is currently enabled. We are interested in Nginx logs.
Filebeat has the nginx module for that and we can enable it using the command
below.
root@helper:~# filebeat modules enable nginx
Enabled nginx
This renames the sample file /etc/filebeat/modules.d/nginx.yml.disabled to
/etc/filebeat/modules.d/nginx.yml. For now, all log collection is still
disabled. We need to edit the file and enable access and error log collection
by setting the access.enabled and error.enabled keys to true.
# Module: nginx
# Docs: https://www.elastic.co/guide/en/beats/filebeat/master/filebeat-module-nginx.html

- module: nginx
  # Access logs
  access:
    enabled: true

    # Set custom paths for the log files. If left empty,
    # Filebeat will choose the paths depending on your OS.
    #var.paths:

  # Error logs
  error:
    enabled: true

    # Set custom paths for the log files. If left empty,
    # Filebeat will choose the paths depending on your OS.
    #var.paths:

  # Ingress-nginx controller logs. This is disabled by default. It could be used in Kubernetes environments to parse ingress-nginx logs
  ingress_controller:
    enabled: false

    # Set custom paths for the log files. If left empty,
    # Filebeat will choose the paths depending on your OS.
    #var.paths:
Connecting to Elasticsearch and Kibana
Finally, we need to tell Filebeat how to connect to the Elasticsearch and Kibana instances.
Before modifying the config we need to do two things:
- get the Elasticsearch server’s CA certificate
- copy it on the
helperVM and install it
In order to get the CA server certificate, you can use the command below on the
elk machine.
[root@elk ~]# scp /etc/elasticsearch/certs/http_ca.crt student@192.168.100.102:~
In order to install the certificate, you can use the following commands on the
helper machine.
root@helper:~$ mkdir -p /usr/local/share/ca-certificates/extra
root@helper:~$ cp /home/student/http_ca.crt /usr/local/share/ca-certificates/extra/elastic.crt
root@helper:~$ update-ca-certificates
We will be using keystores in order to securely store usernames and passwords, instead of simply writing them unencrypted in the configuration file.
In order to create a keystore and insert secrets, we can use the commands below.
Enter your username (elastic) and password (the password for the elastic user,
printed when setting up Elasticsearch).
The filebeat keystore command needs to be run as the same user that will run
filebeat. We will run filebeat as root.
root@helper:~# filebeat keystore create
Created filebeat keystore
root@helper:~# filebeat keystore add ES_USERNAME
Enter value for ES_USERNAME:
Successfully updated the keystore
root@helper:~# filebeat keystore add ES_PWD
Enter value for ES_PWD:
Successfully updated the keystore
root@helper:~# filebeat keystore list
ES_PWD
ES_USERNAME
Now, inside configuration files or CLI commands we can use these secrets we
defined as variables (e.g. output.elasticsearch.password: "${ES_PWD}" or
-E "output.elasticsearch.password=\${ES_PWD}")
We did this so we can modify the output.elasticsearch section in
/etc/filebeat/filebeat.yml to look like this:
output.elasticsearch:
  hosts: ["https://192.168.100.101:9200"]

  protocol: "https"

  username: "${ES_USERNAME}"
  password: "${ES_PWD}"
  tls:
    enabled: true
Also, setup the Kibana location
setup.kibana:
  host: "192.168.100.101:5601"
You can run filebeat test config -e in order to test the Filebeat configuration.
To enable the default dashboards for the enabled module run
root@helper:~# filebeat setup -e --modules nginx -M "nginx.access.enabled=true" -M "nginx.error.enabled=true"
The two -M options are required due to a bug
in the version we are using.
Now we can start the Filebeat service (as the root user)
root@helper:~# systemctl start filebeat
Visualizing Filebeat data
Before visualizing the data, generate some traffic to the webserver, from as
many sources as you can (local VM, Openstack VM, elk VM, your personal PC
using ssh SOCKS proxy). You can even try to request non-existent pages.
The raw logs can be found by going to the Analytics > Discover tab and
selecting the filebeat-* index.
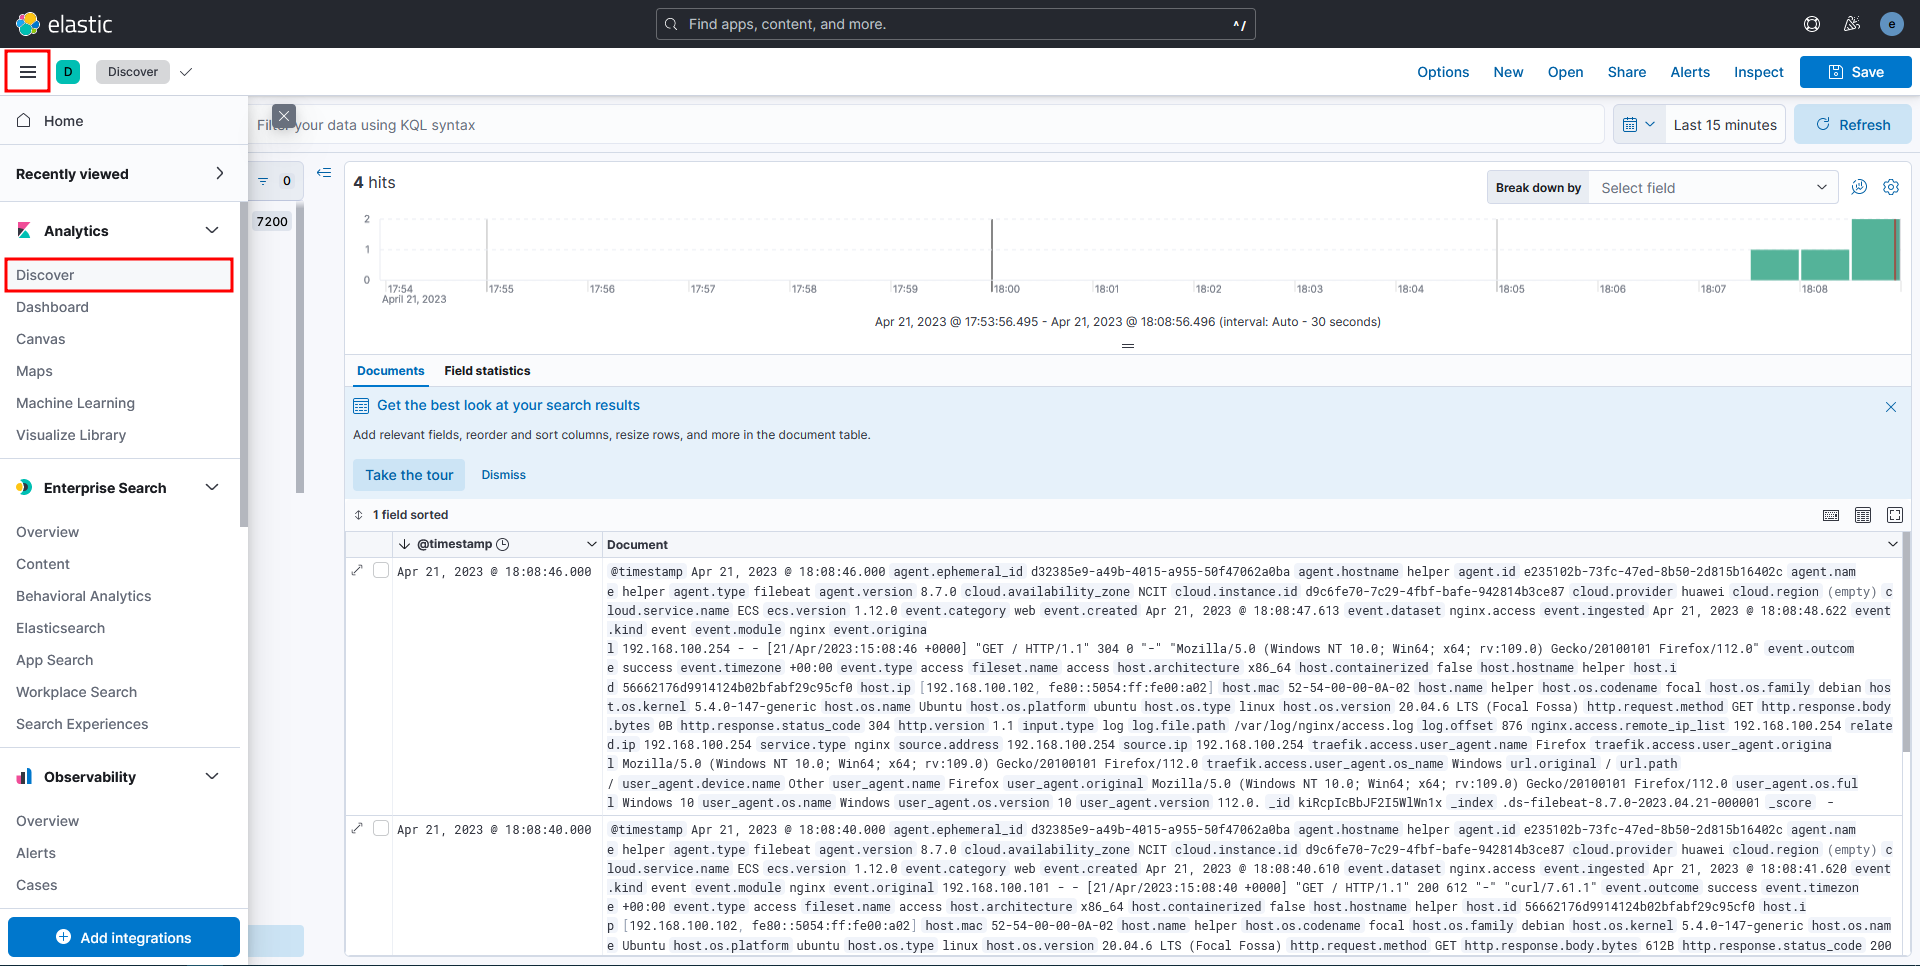
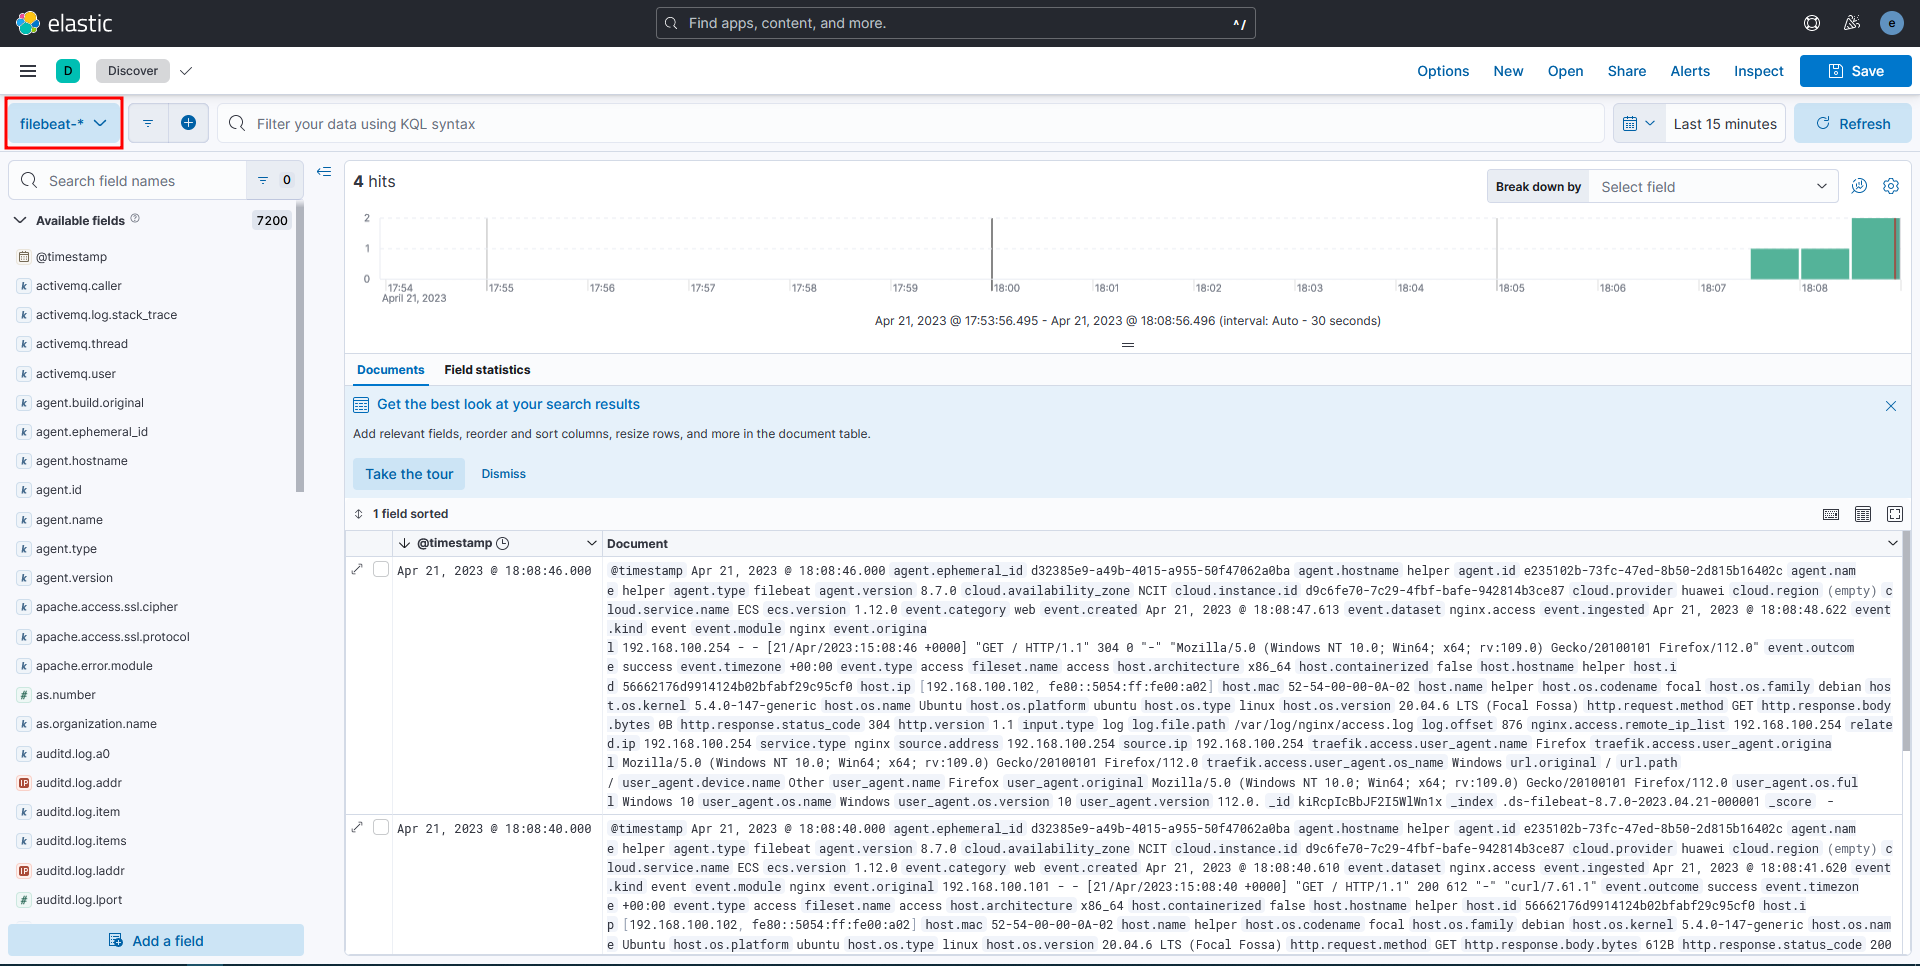
This is an unrefined view of the data. You can filter interesting fields by
pressing on them in the left side of the screen, under Available fields.
An useful way to visualize data is through dashboards. You can define your own
dashboards, but we’ll use the default ones created by filebeat by going to the
Analytics > Dashboard tab and searching for "nginx".
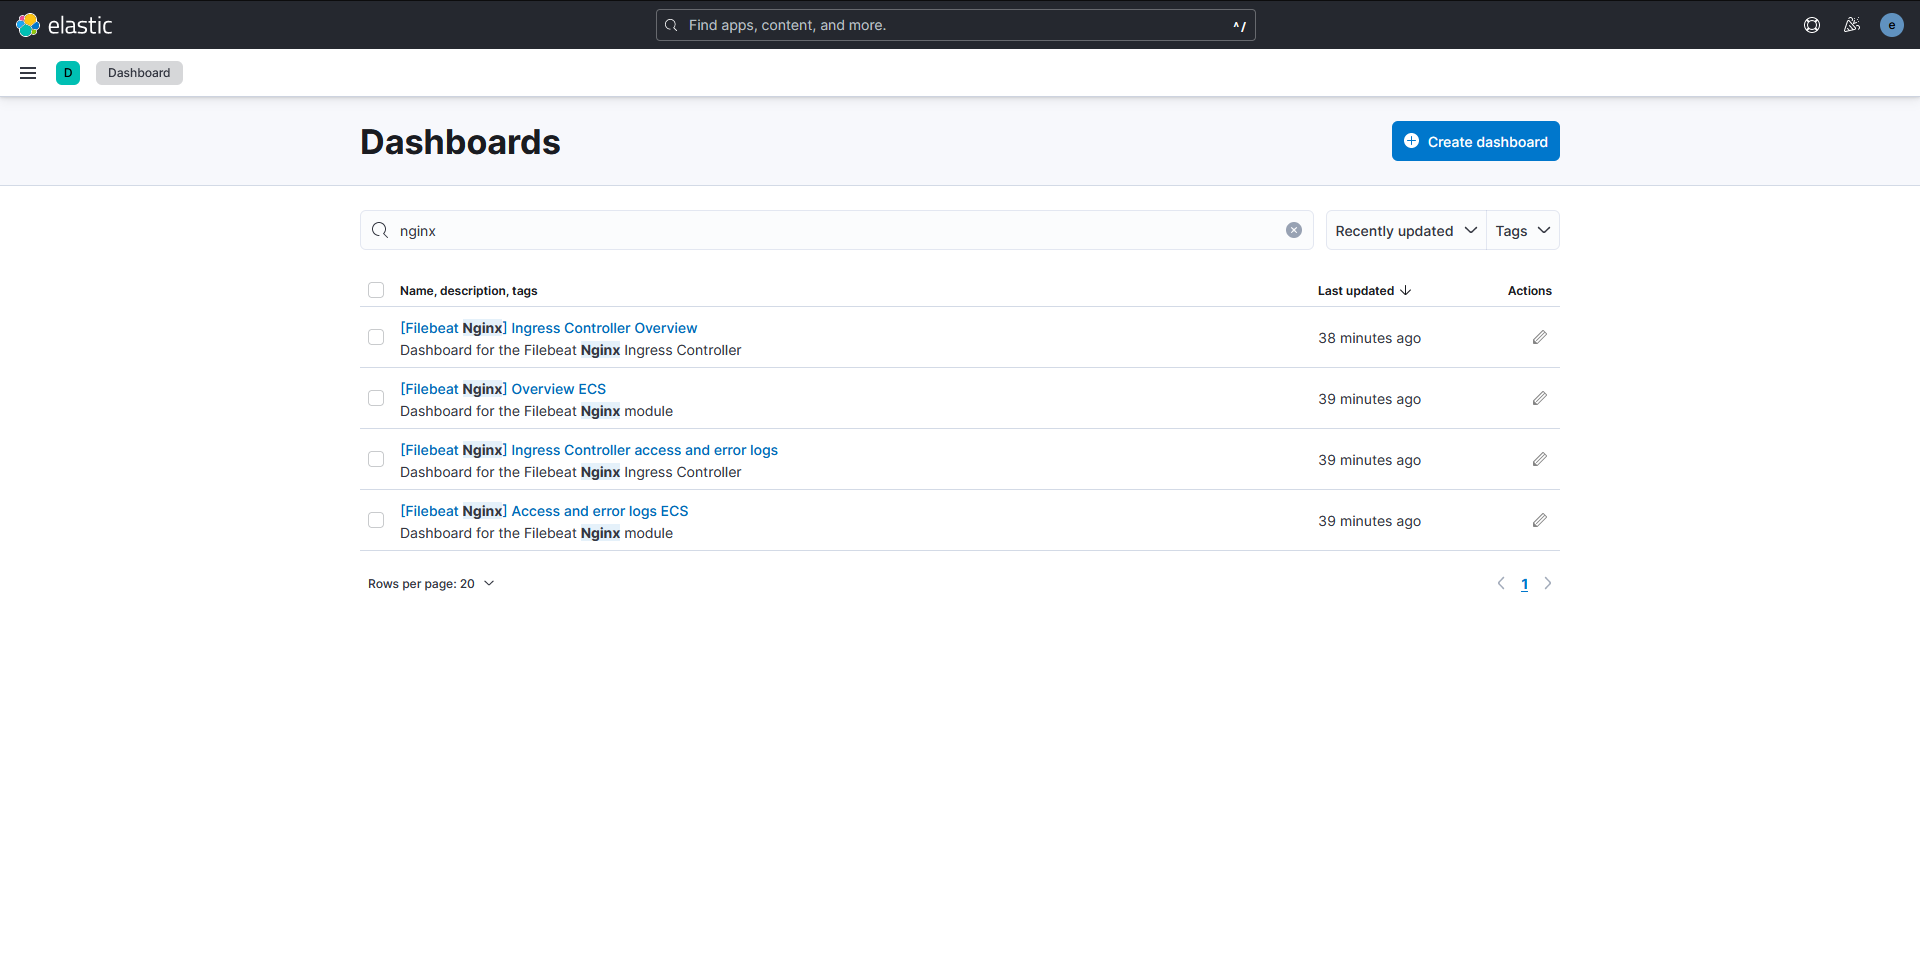
The Ingress dashboards are not useful to us, since we are not in a Kubernetes environment. Check out the "Overview ECS" and "Access and error logs ECS" dashboards.
You can filter in or out various values that you find in the tables and the changes will be reflected in the graphs. You can also filter data using KQL (Kibana Query Language) at the top of the page. Read more about it here.
Task
Someone keeps trying to exploit/scan the web server. Determine the source IP of the attacker using the Filebeat logs.
You can identify the traffic in the Dashboard and filter accordingly in the Discover tab.
You can also use Security > Explore > Hosts.
Monitoring network traffic with Packetbeat
Installing and configuring Packetbeat
Installing Packetbeat follows the same steps as Filebeat.
-
Download the DEB package and signature
student@helper:~$ wget https://artifacts.elastic.co/downloads/beats/packetbeat/packetbeat-8.7.0-amd64.deb
student@helper:~$ wget https://artifacts.elastic.co/downloads/beats/packetbeat/packetbeat-8.7.0-amd64.deb.sha512 -
Check the signature is ok
student@helper:~$ sha512sum -c packetbeat-8.7.0-amd64.deb.sha512
packetbeat-8.7.0-amd64.deb: OK -
Install using
dpkgstudent@helper:~$ sudo dpkg -i packetbeat-8.7.0-amd64.deb
Selecting previously unselected package packetbeat.
(Reading database ... 41359 files and directories currently installed.)
Preparing to unpack packetbeat-8.7.0-amd64.deb ...
Unpacking packetbeat (8.7.0) ...
Setting up packetbeat (8.7.0) ...
Processing triggers for systemd (245.4-4ubuntu3.21) ...
The configuration file can be found at /etc/packetbeat/packetbeat.yml. Since
we are using Linux, we can change the sniffer type to a more efficient one than
the default by adding packetbeat.interfaces.type to af_packet. On other
platforms you need to use libpcap. Make sure it is installed on your system in
that case.
Next, modify the interfaces you want to capture traffic from. You can specify
any to capture traffic from all interfaces, but, for the current lab we are
interested only in the traffic that flows through interface eth0.
In the same file we can see the configurations for the protocols we want to sniff. It contains the most popular protocols and we will use it as is, but you can define your own if needed.
Example configuration file
# =============================== Network device ===============================

#[...]

packetbeat.interfaces.device: eth0
packetbeat.interfaces.type: af_packet

# Specify the amount of time between polling for changes in the default
# route. This option is only used when one of the default route devices
# is specified.
packetbeat.interfaces.poll_default_route: 1m

# The network CIDR blocks that are considered "internal" networks for
# the purpose of network perimeter boundary classification. The valid
# values for internal_networks are the same as those that can be used
# with processor network conditions.
#
# For a list of available values see:
# https://www.elastic.co/guide/en/beats/packetbeat/current/defining-processors.html#condition-network
packetbeat.interfaces.internal_networks:
  - private

[...]
Connecting to Elasticsearch and Kibana
As before, we need to setup a keystore for our sensitive data.
root@helper:~# packetbeat keystore create
Created packetbeat keystore
root@helper:~# packetbeat keystore add ES_USERNAME
Enter value for ES_USERNAME:
Successfully updated the keystore
root@helper:~# packetbeat keystore add ES_PWD
Enter value for ES_PWD:
Successfully updated the keystore
Once you have done that, follow the instructions from the Filebeat section to
specify the location of Elasticsearch and Kibana. The parameters used in the
configuration are the same. You can check that your configuration file is ok
with packetbeat test config -e.
Finally, setup dashboards and ingest pipelines with packetbeat setup -e and
start Packetbeat.
root@helper:~# systemctl daemon-reload
root@helper:~# systemctl enable --now packetbeat
Synchronizing state of packetbeat.service with SysV service script with /lib/systemd/systemd-sysv-install.
Executing: /lib/systemd/systemd-sysv-install enable packetbeat
Created symlink /etc/systemd/system/multi-user.target.wants/packetbeat.service → /lib/systemd/system/packetbeat.service.
Visualizing Packetbeat data
Before going to Kibana, generate both some outbound traffic (web traffic using
wget/curl, DNS requests using host/dig, ICMP traffic using ping) and inbound
traffic by hitting the webserver from the previous section or by pinging the
helper VM from the outside (Openstack VM, elk VM).
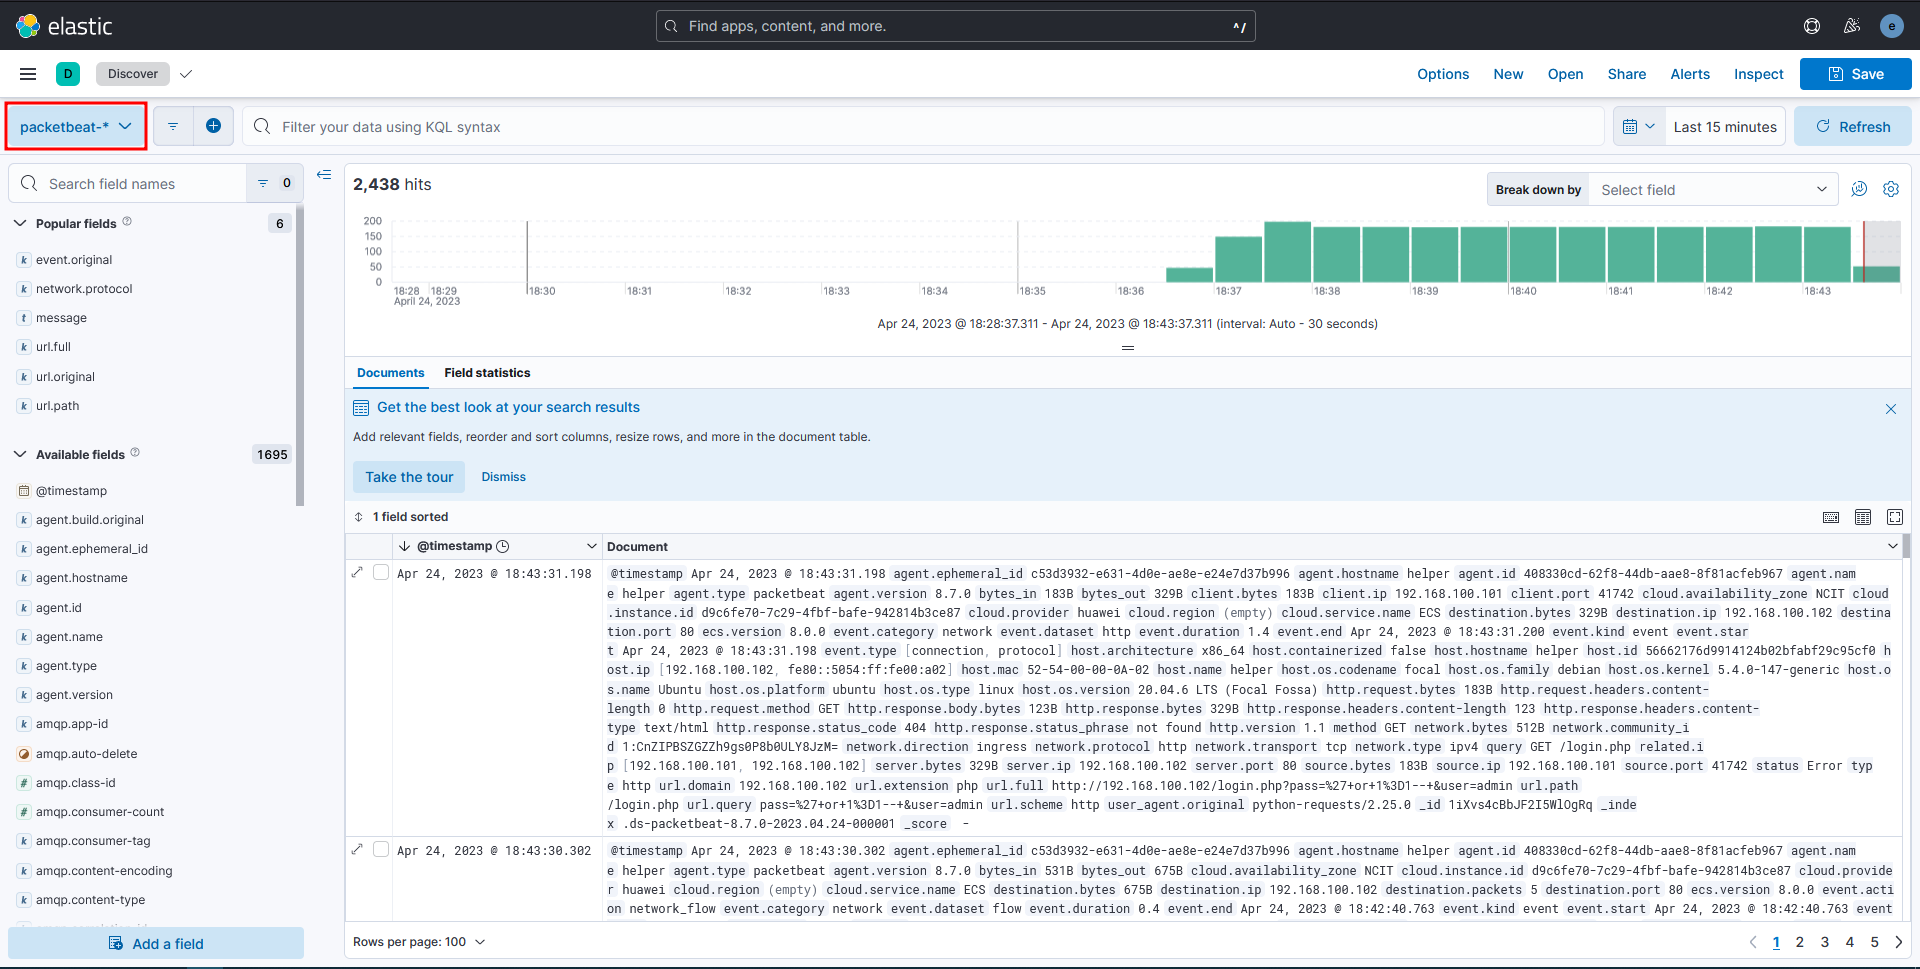
As before, you can view the raw logs and filter the fields that interest you in
the Analytics > Discover tab. Packetbeat will send logs to a different index,
so make sure to switch it from the upper left corner.
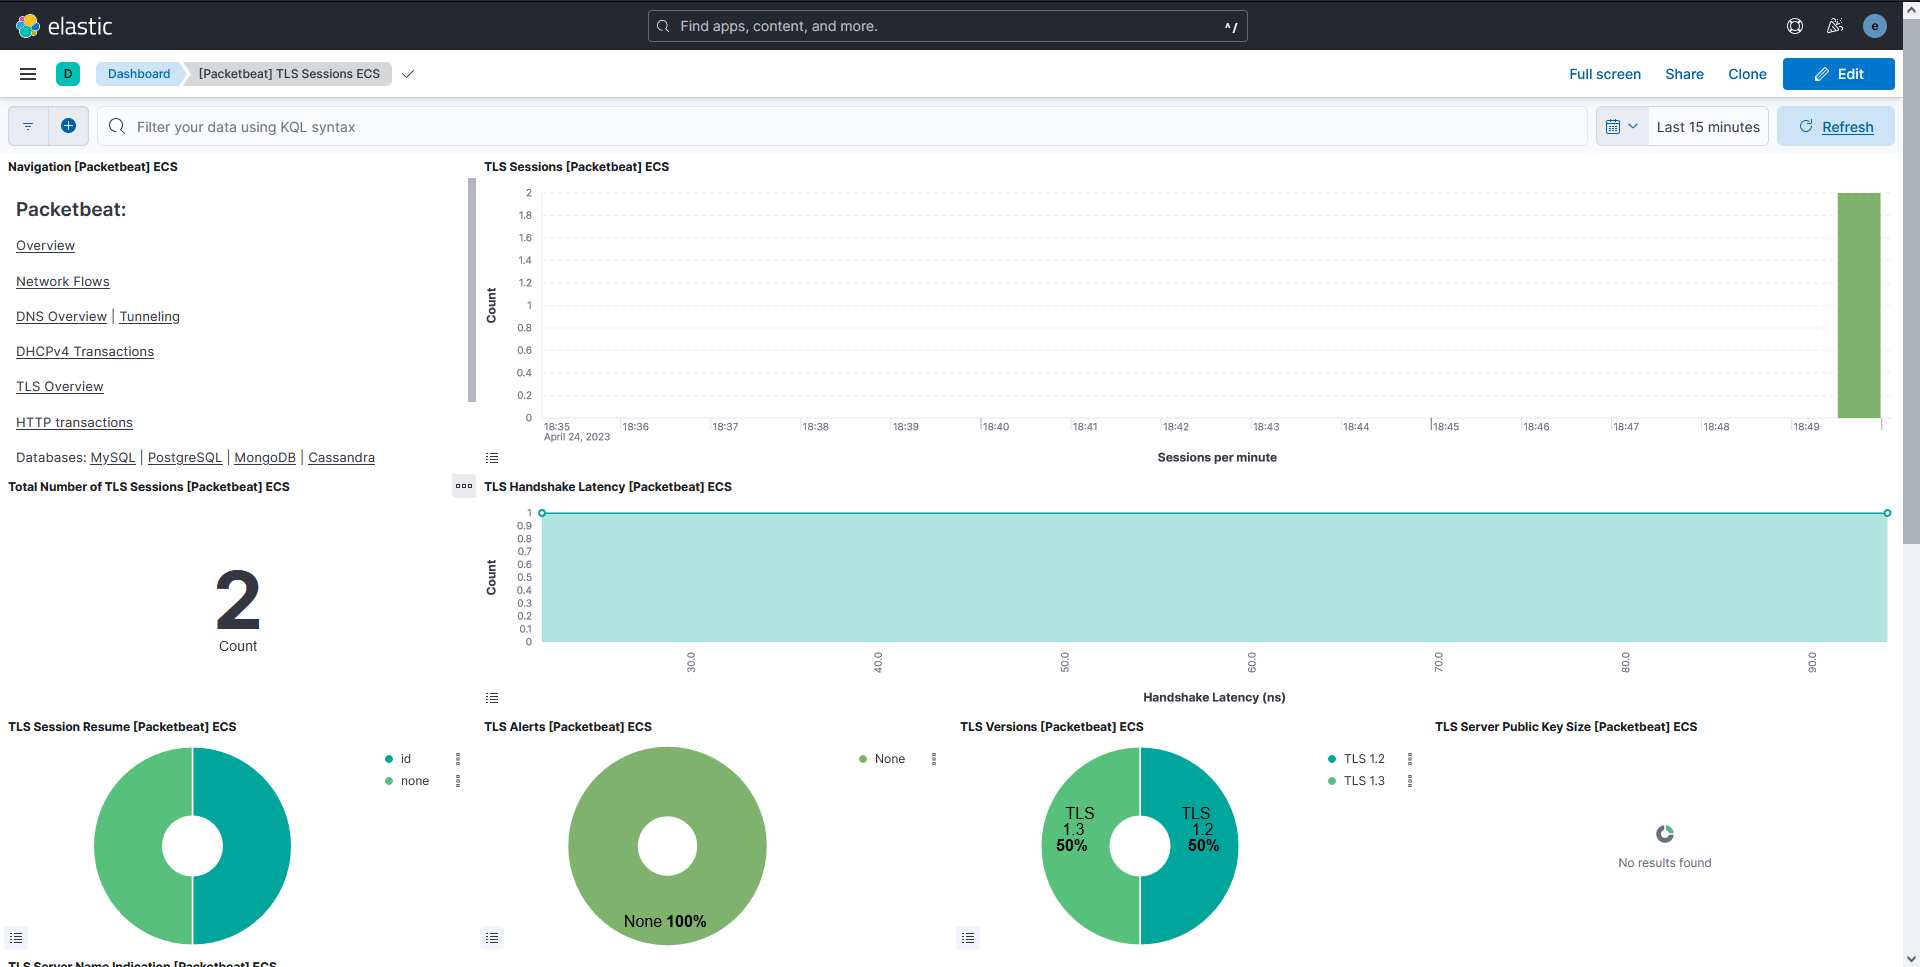
In order to view the Packetbeat dashboards, go to the Analytics > Dashboards
tab and search for Packetbeat. Take a look at the dashboards for the traffic you
have generated.
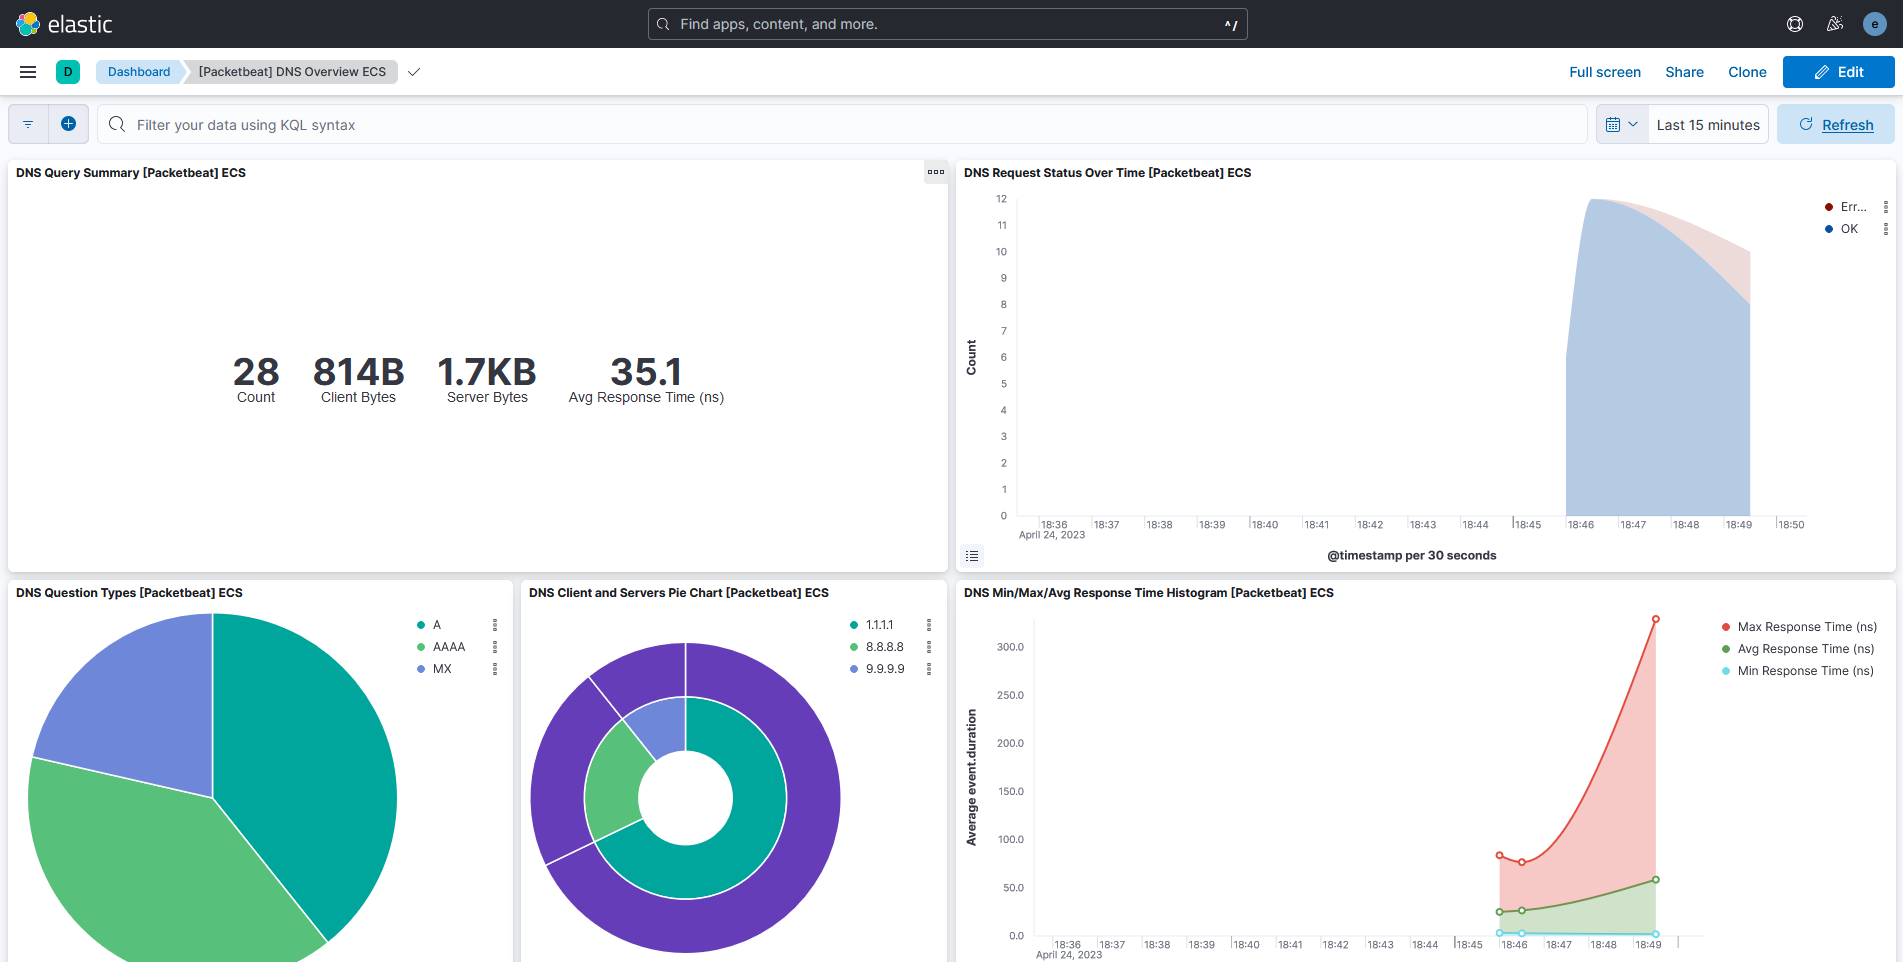
Task
There is a service that is slowly exfiltrating data from the monitored machine. Can you spot the exfiltrated data using the Packetbeat dashboards and logs?
Monitoring hosts using Auditbeat
Installing and configuring auditbeat
Auditbeat installation is identical to the other Beats.
-
Download the DEB package and signature
root@helper:~$ wget https://artifacts.elastic.co/downloads/beats/auditbeat/auditbeat-8.7.0-amd64.deb
root@helper:~$ wget https://artifacts.elastic.co/downloads/beats/auditbeat/auditbeat-8.7.0-amd64.deb.sha512 -
Check the signature is ok
root@helper:~$ sha512sum -c auditbeat-8.7.0-amd64.deb.sha512
auditbeat-8.7.0-amd64.deb: OK -
Install using
dpkgroot@helper:~$ dpkg -i auditbeat-8.7.0-amd64.deb
Selecting previously unselected package auditbeat.
(Reading database ... 41359 files and directories currently installed.)
Preparing to unpack auditbeat-8.7.0-amd64.deb ...
Unpacking auditbeat (8.7.0) ...
Setting up auditbeat (8.7.0) ...
Processing triggers for systemd (245.4-4ubuntu3.21) ...
The default configuration is in /etc/auditbeat/auditbeat/yml. For this lab, we
are not interested in configuring the Auditd and File Integrity modules, so we
will remove (or comment) them from the configuration.
The System module collects information from multiple configurable datasets. These are:
host- general host informationlogin- user authentication eventsprocess- started and stopped processessocket- opened and closed socketsuser- general user information
Auditbeat uses a polling mechanism to collect information. As you can see, some of the above datasets are changing more frequently than others. For example, general host information like the hostname and IPs associated with it will rarely change, but processes are constantly firing off. In order to be efficient in our resource usage, we will configure datasets in a more granular manner, specifying smaller polling intervals for the ones that change frequently and bigger polling intervals for the rarely changing ones.
Use a similar configuration to the one below:
auditbeat.modules:

- module: system
    datasets:
        - package

    period: 15m
    state.period: 12h

- module: system
    datasets:
        - host
        - user

    period: 12h
    state.period: 24h

- module: system
    datasets:
        - login

    user.detect_password_changes: true

  login.wtmp_file_pattern: /var/log/wtmp*
  login.btmp_file_pattern: /var/log/btmp*

    period: 5m

- module: system
    datasets:
        - process
        #- socket

    period: 1s
We won’t configure the socket dataset as it can generate quite a lot of data,
but it would benefit from the same low polling period as the process dataset.
The difference between period and state.period is that state.period will
send the full state of the system instead of incremental updates.
Connecting to Elasticsearch and Kibana
Follow the same procedure outlined in the Filebeat and Packetbeat sections,
replacing the appropriate CLI command with auditbeat.
Visualizing Auditbeat data
Before visiting Kibana, keep using the helper VM to generate logs (start some
processes, edit some files, download something).
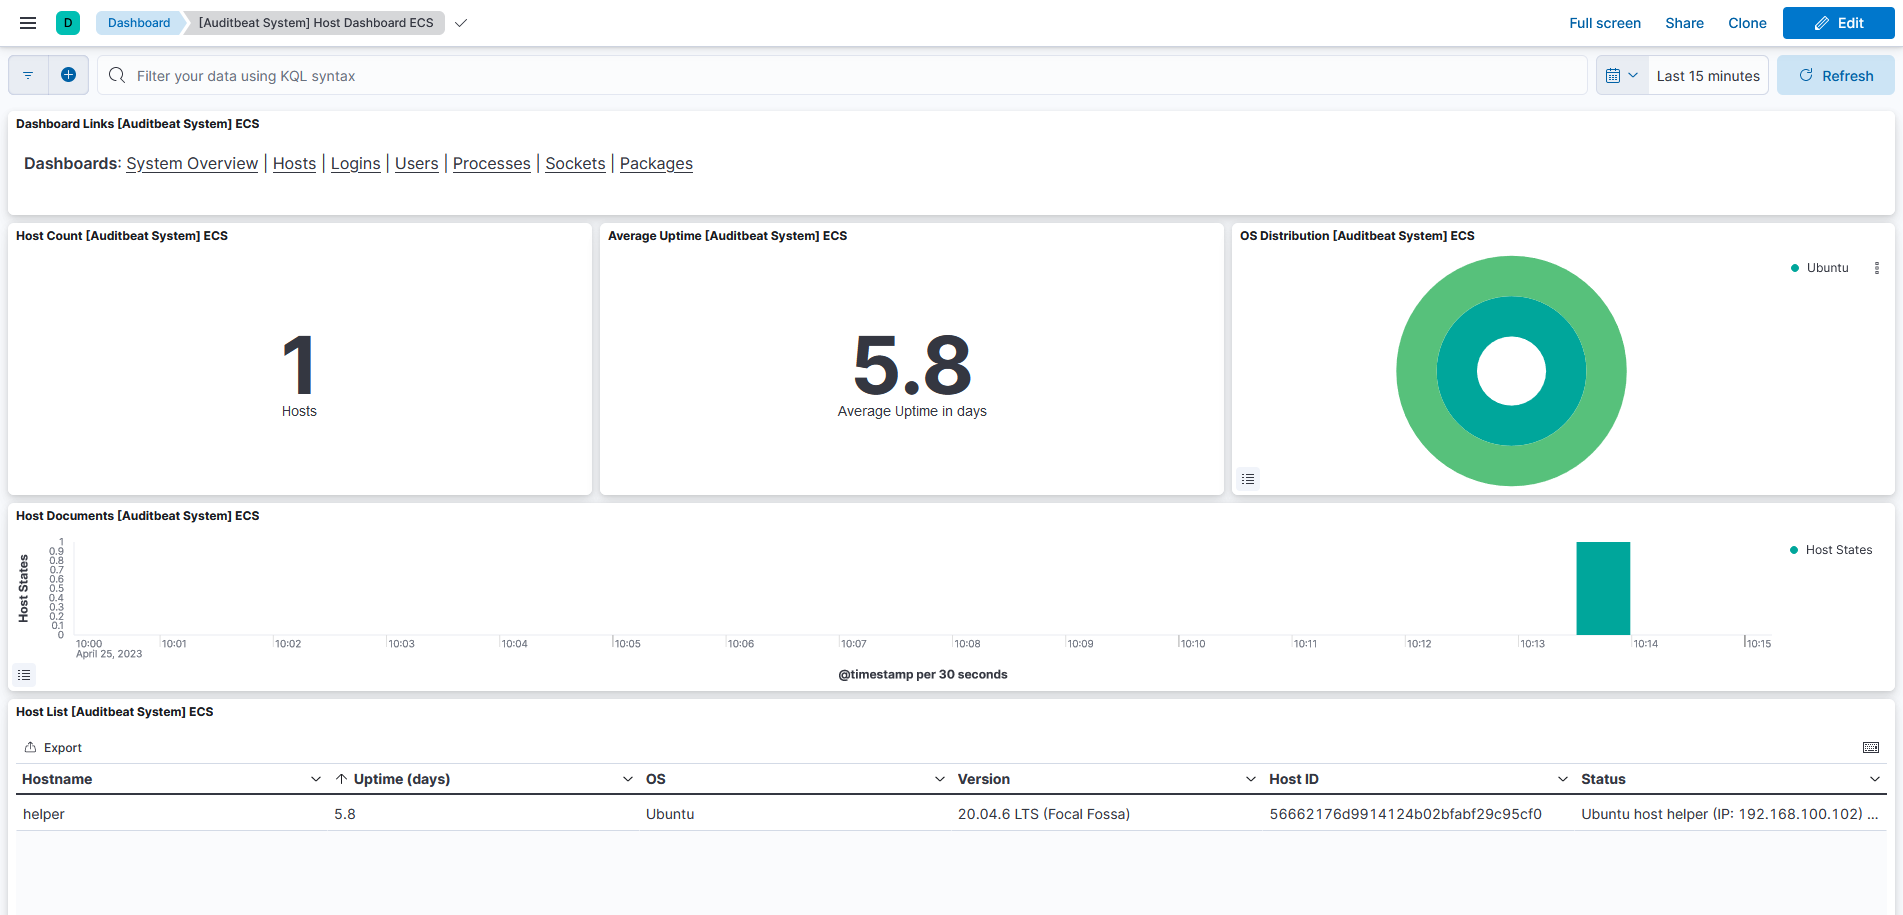
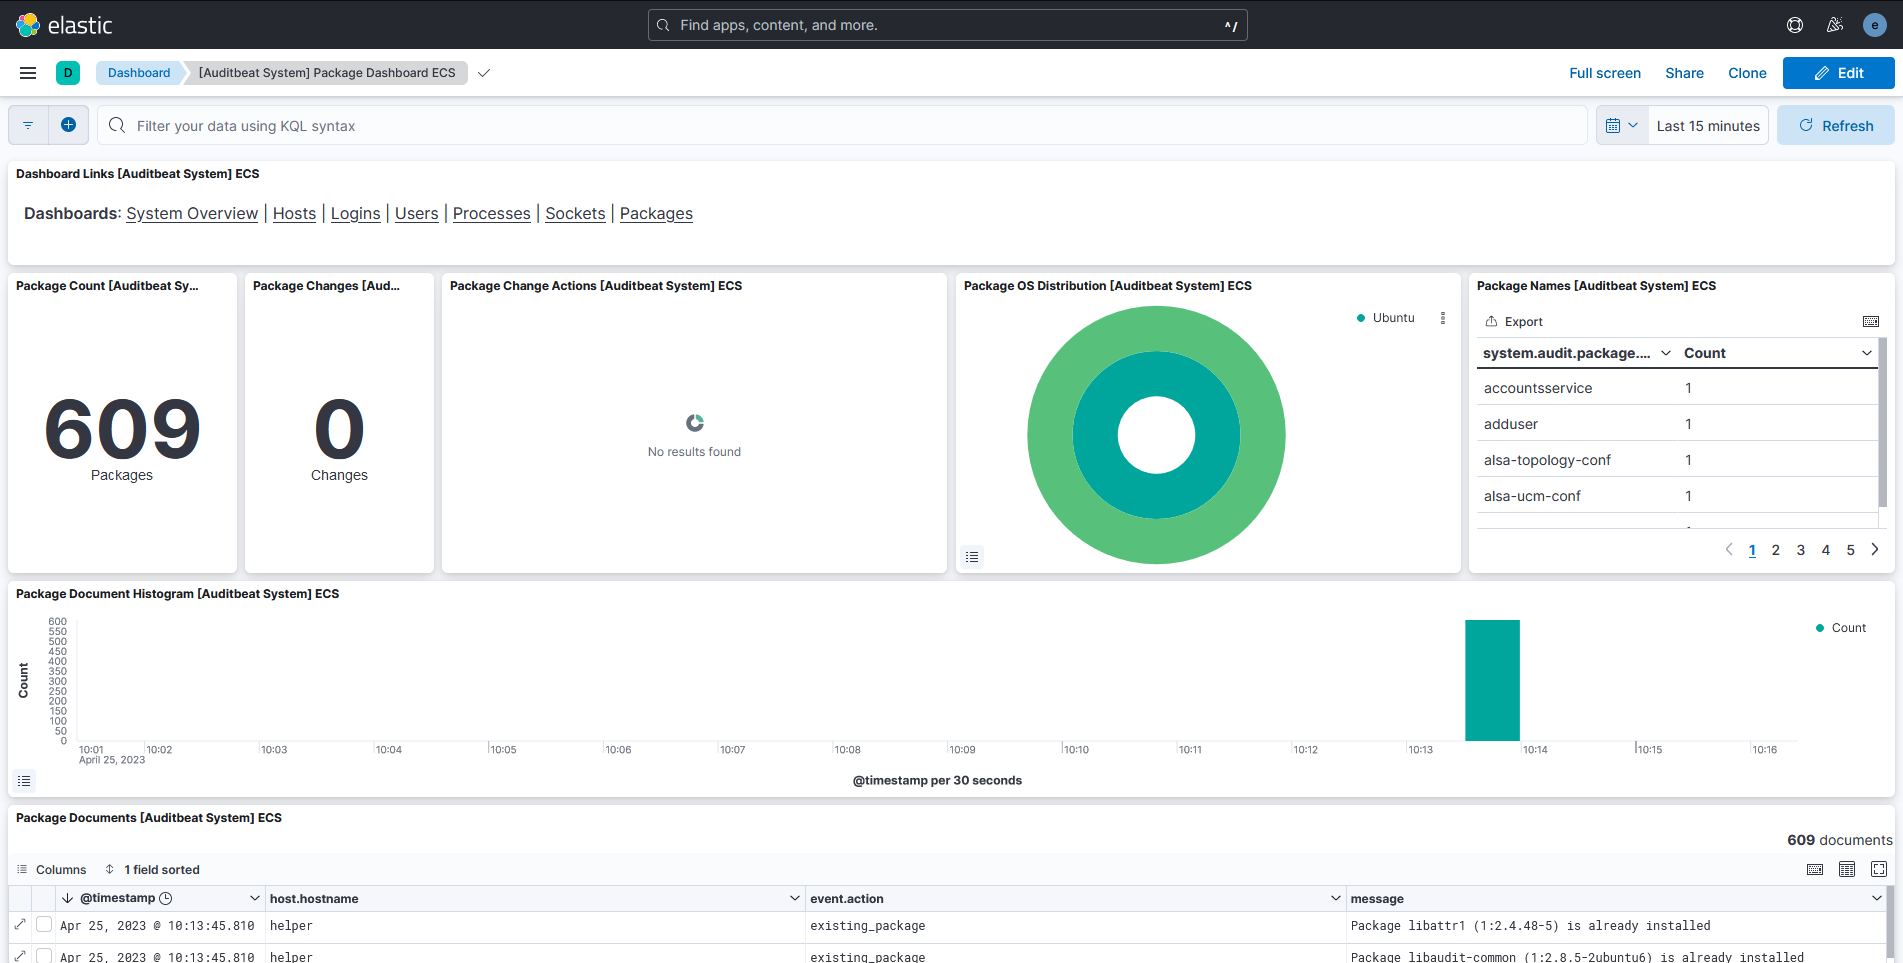
Explore some of the Auditbeat Dashboards by going to the Analytics > Dashboard
tab and searching for Auditbeat.

Security Dashboards
The ELK stack can be used as a SIEM (Security Information and Event Management)
system. You can find SIEM functionality under the Security tab in the sidebar.
Some of it is locked under a subscription, but there are some interesting
Dashboards that aggregate information from various beats and present it in a
security-centered fashion, such as the ones you find under Security > Explore.
Task
There is a weird program that keeps running for short periods of time on the system. Can you find its location on the system? Hint: use the Security dashboards we presented earlier.
(BONUS) Custom log formats with Logstash
Before starting this section we recommend stopping previous Beats, in order to have a clean work environment and less resource usage on both VMs.
Logstash is one of the components of the Elastic Stack. It is optional, but it is commonly used as a middleware layer between Beats and Elasticsearch. It also provides ingest pipeline functionality, allowing you to ingest, process and enrich logs in formats not supported by Beats.
Installation
Details about installing Logstash can be found
here.
For your convenience, it has already been installed on the elk VM under
/usr/share/logstash.
Creating a logstash pipeline
There is a command logger running on the system (Snoopy). You can find more
details about it on the project's GitHub page.
Snoopy has been configured to log data in a custom way not supported by default
in Filebeat. Make sure it is running using snoopyctl status. Enable it if
necessary using snoopyctl enable.
Data is logged to /var/log/snoopy.log and the service configuration file is in
/etc/snoopy.ini.
Examine the files, setup Filebeat to send data to Logstash and create a Logstash
pipeline to ingest the logs in a structured way in Elasticsearch. For field
extraction you can use the grok or dissect plugins.